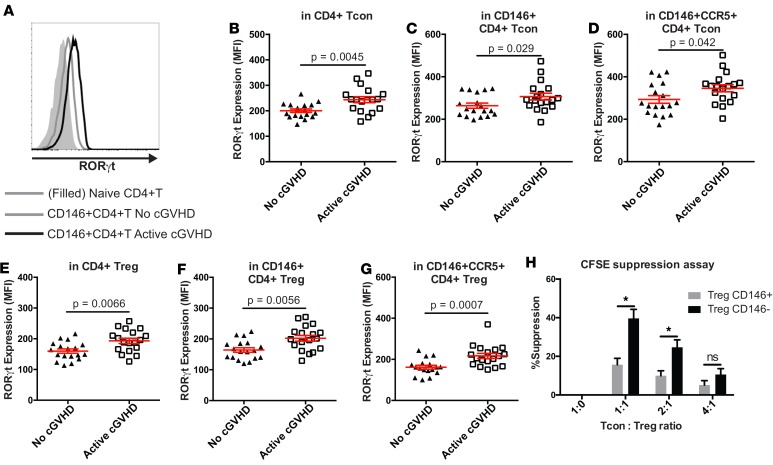
Figure 2. Analysis of Th17-related transcription factor according to CD146 and CCR5 expression.
(A) Single parameter histogram representing RORγt expression and comparing the level of expression in naive CD4+ T cells (CD45RA+) with the 1 in CD146+ CD4 T cells in 1 active-cGvHD and 1 no-cGvHD representative patients. (B–G) RORγt intracellular staining in CD146+ and CD146+CCR5+ subsets (Tcon and Treg) revealed a skewed polarization toward a Th17 profile in cGvHD patients. Data shown are dot plots (mean ± SEM) according to different clinical groups: No (n = 18) or active cGvHD (n = 18). Unpaired t test comparing RORγt MFI between groups. (H) Comparison of Treg suppressive capacity according to CD146 expression. Treg were sorted according to the expression of CD146 and cocultured with CFSE-labeled Tcon for 5 days at different ratios upon stimulation with coated αCD3 and soluble αCD28. Bar graph representing mean ± SEM values after 6 experiments. *P < 0.05, paired t test. Comparisons in B–G were analyzed using the Wilcoxon rank-sum test. Comparisons in H were analyzed using the Wilcoxon signed-rank test.

