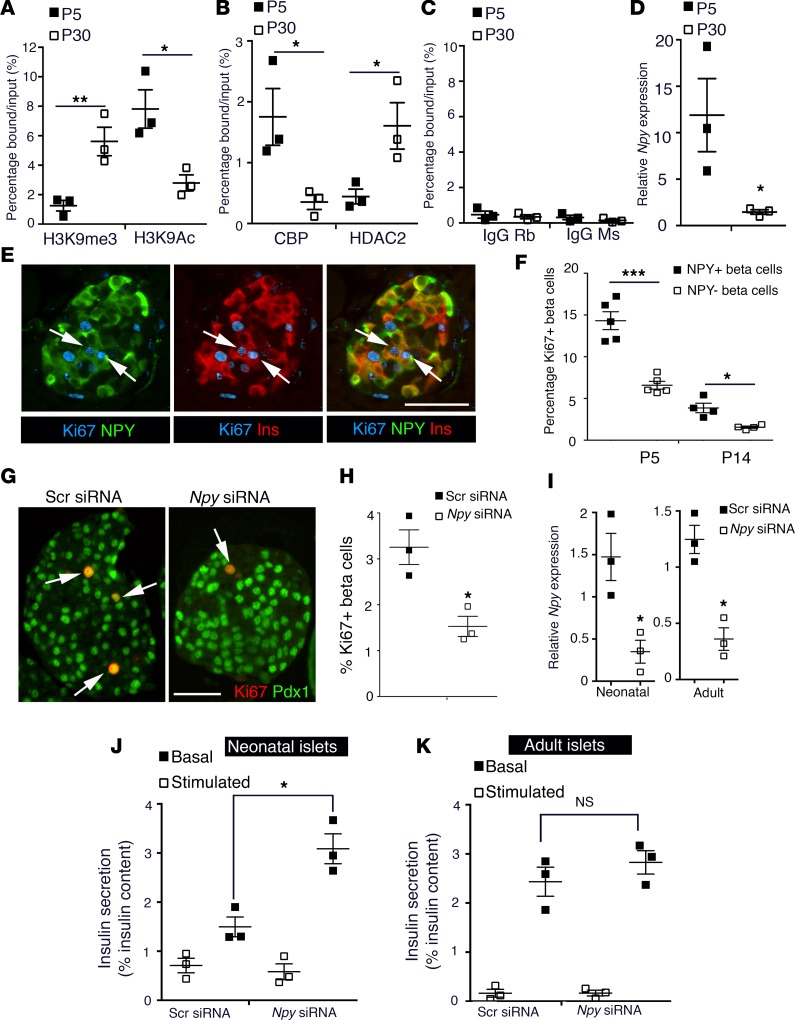
Figure 4. NPY expression is epigenetically regulated and modulates β cell maturation.
(A–C) ChIP analysis showing the enrichment of histone modifications (A) H3K9me3 (histone H3-lysine 9 trimethylation; repressive) and H3K9Ac (histone H3 lysine 9 acetylation; activating), (B) histone acetyl transferase CBP (CREB-binding protein) and histone deacteylase HDAC2, (C) along with control rabbit and mouse IgGs, to the Npy promoter region in β cells sorted from MIP-GFP mice at P5 and P30. These data show the epigenetic repression of the Npy promoter as a function of maturation. (D) Npy mRNA expression levels, normalized to the housekeeping gene CyclophilinA in β cells sorted from MIP-GFP mice, in which GFP expression is driven by insulin promoter at P5 and P30, showing reduced expression as a function of maturation. (E) A representative pancreatic section from wild-type, neonatal (P5) mice showing immunostaining for NPY (green), insulin (Ins; red), and Ki67 (cyan). Arrows mark replicating NPY+ β cells. (F) Quantification of replication marker Ki67 in the NPY+ and NPY– subpopulations of β cells in wild-type neonatal mice at P5 and P14. (G) Immunohistochemistry and (H) quantification for replication of β cells in islets isolated from neonatal (P5) mice treated with an siRNA targeting Npy or a control, scrambled siRNA. Immunostaining for replication marker Ki67 (red) and β cell marker Pdx1 (green) was used to measure β cell replication. Arrows mark Ki67 Pdx1 double-positive cells. (I–K) Npy mRNA levels and static incubation glucose-stimulated insulin secretion (GSIS) assay in islets from (I) wild-type, (J) P5 pups, or (K) adult (2.5-month-old) mice, treated either with an siRNA targeting Npy or a scrambled (Scr) siRNA. Insulin secretion was measured at 2.8 mM glucose (basal) and 16.7 mM (stimulated) glucose and reported as a percentage of insulin content. Scale bar: 50 μm. For A–D, average of n = 3 independent sorts; each sort had 6–8 pups at P5 and 4 mice at P30. For E and F, n = 4 animals. For G–K, n = 3 independent experiments, with each replicate representing a pool of islets from 6–8 pups. The error bars represent SEM of the mean. *P < 0.05, **P < 0.01, ***P < 0.005. A 2-tailed Student’s t test was used for A–D, H, and I to determine statistical significance. For F, J, and K (which involved repeat measures), statistical significance was determined by 1-way ANOVA followed by Bonferroni’s post-hoc test.

