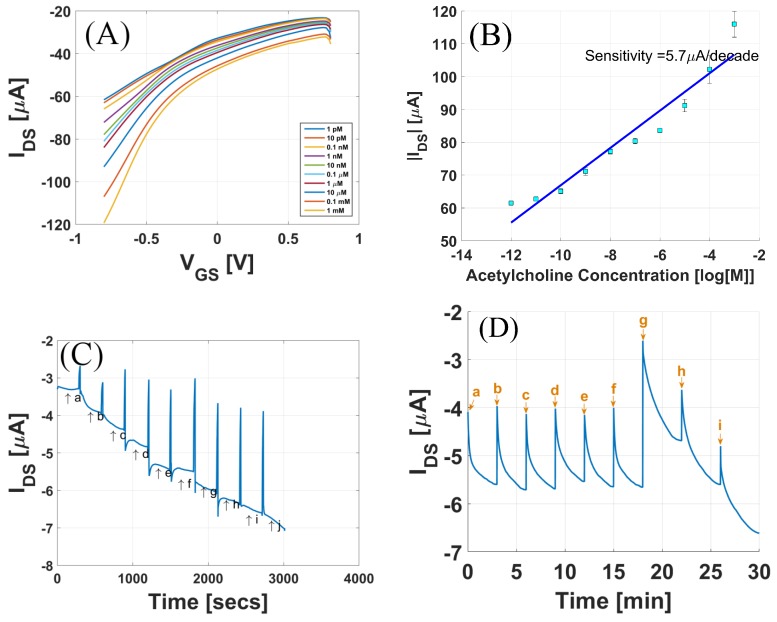
Figure 5.
(A) Response of the sensor to different acetylcholine concentration; (B) Drain Current (I) vs. acetylcholine concentration; (C) Real-time response of the sensor from 1 pM to 1 mM concentration range. a = 1 pM, b = 10 pM, c = 0.1 nM, d = 1 nM, e = 10 nM, f = 0.1 M, g = 1 M, h = 10 M, i = 0.1 mM, j = 1 mM. (D) Selectivity tests for sensor in the presence of serine and glycine.

