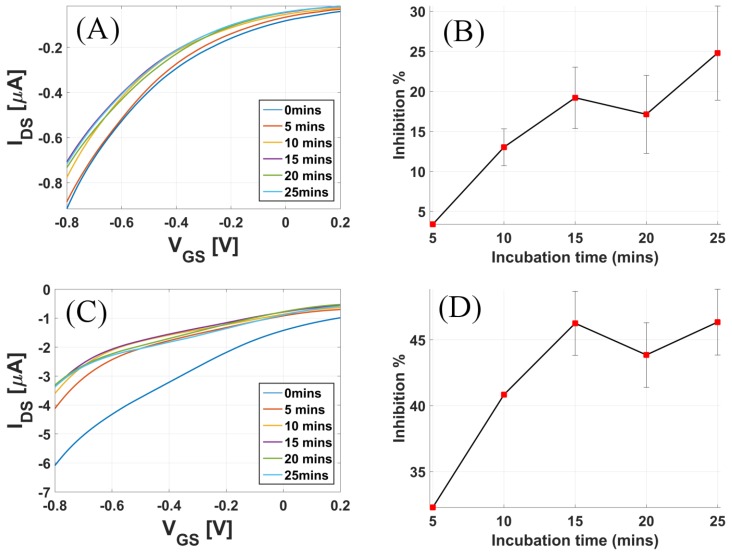
Figure 8.
Real sample analysis: Transfer curves for increasing incubation time when the sensor was exposed to (A) 1.35 mg malathion in 1 mL tap water and (C) 1.35 mg malathion mixed in 1 mL strawberry pulp. Inhibition% of enzyme activity when the sensor was exposed to (B) 1.35 mg malathion in 1 mL tap water and (D) 1.35 mg malathion mixed in 1 mL strawberry pulp.

