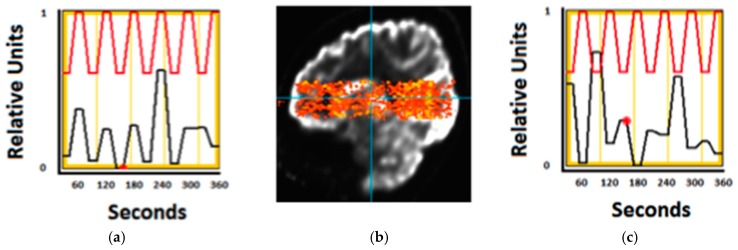
Figure 7.
(b) Image from Generation 0 imager (activity in warm colors) is overlaid onto that of standard PET anatomical slice (greyscale) to show the plane of image acquisition on the head. This is a sagittal slice from front (left) to back (right) of brain, with the top of the brain at the top of the picture and cerebellum/brain stem at the bottom. Individual voxels were analyzed to see if they either increased in activity during the hand task (correlated, (a)) vs. foot tapping task (anti-correlated, (c)). Red represents an ideal model waveform, while the black represents actual intensity differences in the image due to higher count rates (averaged to one measure during each 30 s period for this analysis).

