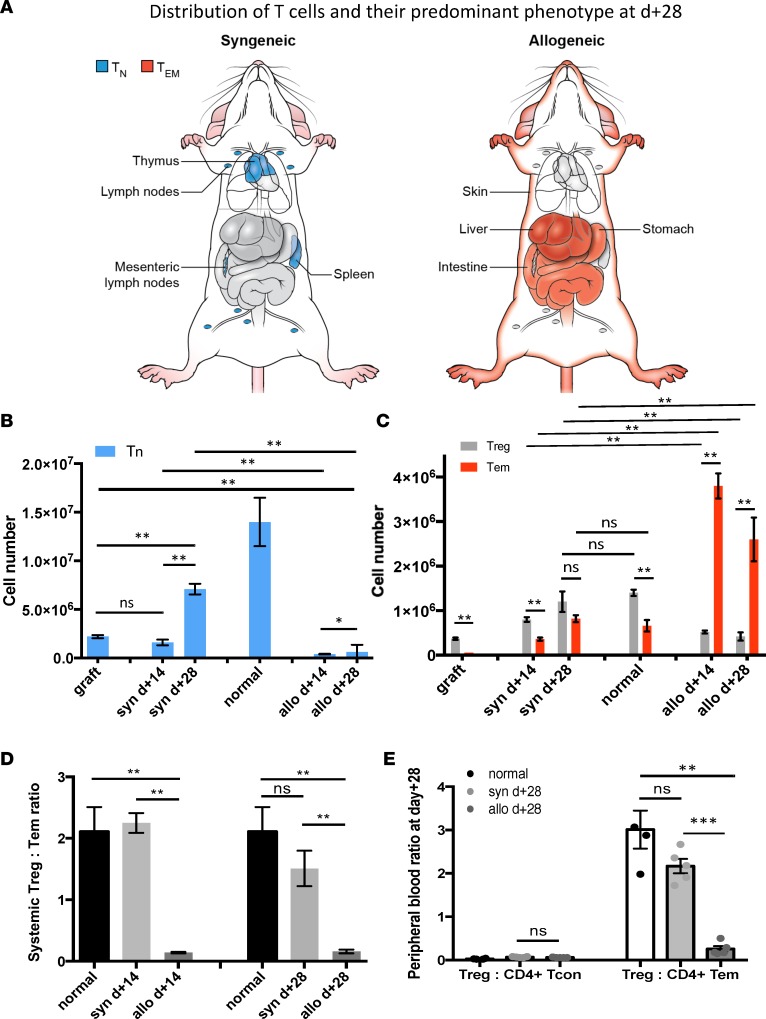
Figure 1. CD4+ T cell pool size, composition, and distribution for normal mice and syngeneic (syn) and allogeneic (allo) hematopoietic stem cell transplant recipients.
CD4+ T cell numbers extracted from spleen, parenchymal liver, small intestine, flank skin, and blood were combined. (A) Graphic representation of the predominant CD4+ T cell subset distribution in syngeneic and allogeneic recipients at day +28. In the syngeneic setting, CD4+ T cells primarily found in lymphoid organs and of Tn phenotype. In the allogeneic setting, CD4+ T cells were primarily in target tissues (skin, liver, gut) and of Tem phenotype. (B) The mean total Tn cell number within the graft, normal mice, and syngeneic and allogeneic recipients at day +14 and +28. (C) The mean total Tem and Treg numbers within the graft, normal mice, and syngeneic and allogeneic recipients at day +14 and +28. (D) Treg/Tem ratio was > 1 in the graft, syngeneic recipients, and normal mice, while it was < 1 in cGVHD setting. (E) Treg/CD4+ TCON ratio vs. Treg/CD4+ Tem ratio for normal mice, and syngeneic and allogeneic recipients at day +28 in blood. Data are representative of more than 3 independent experiments. For panels B–E, n = 10; **P < 0.01, ***P < 0.001; Tukey’s test with 2-way ANOVA.

