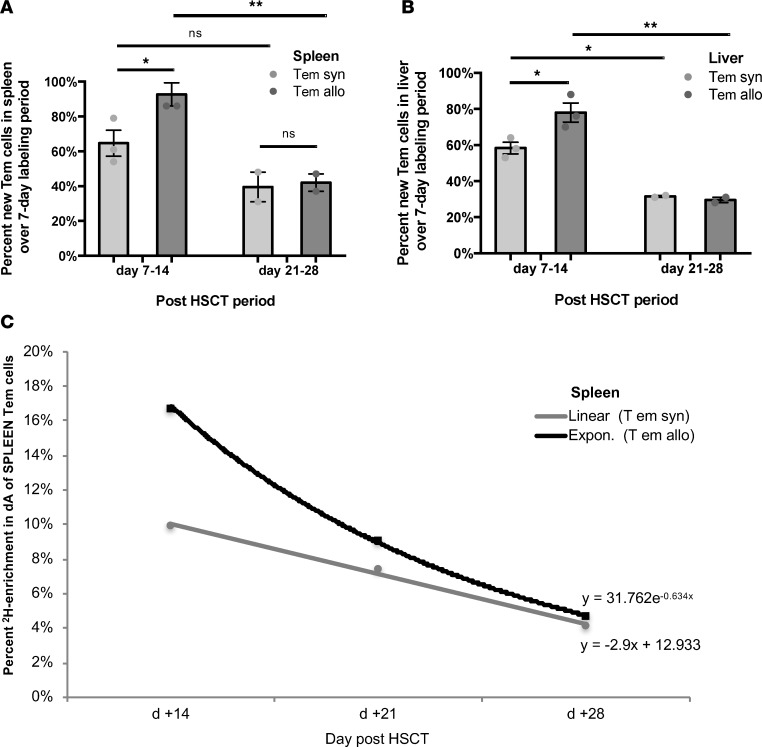
Figure 5. CD4+ Tem in vivo cell kinetics show robust cell gain in the spleen and liver in allogeneic (allo) hematopoietic stem cell transplant recipients (HSCT), with rapid concurrent label loss kinetics in the spleen and increased number in circulation.
(A) Percentage of new Tem cells in the spleen for each experimental cohort measured at day +14 and +28, following 7 days of labeling for each time point. Data for 5 independent experiments were pooled for the day +7 to +14 analysis (each independent experiment represents a pooled sample from n = 2–7 mice), and 3 independent experiments for day +21 to +28 analysis. (B) Percentage of new Tem cells in the liver for each experimental cohort measured at day +14 and +28, following 7 days of labeling for each time point. Data for 3 independent experiments were pooled for the day +7 to +14 analysis (each independent experiment represents a pooled sample from n = 5–8 mice), and 2 independent experiments for day +21 to +28 analysis. (C) Label loss kinetics for Tem cells from spleens of allogeneic versus syngeneic recipients. Data are representative of 2 independent experiments (each independent experiment represents a pooled sample from n = 2–7 mice). Data are representative of 4 independent experiments (n = 2–6 mice per experiment per cohort). For panels A and B, *P < 0.05, **P < 0.01; Tukey’s test with 2-way ANOVA.

