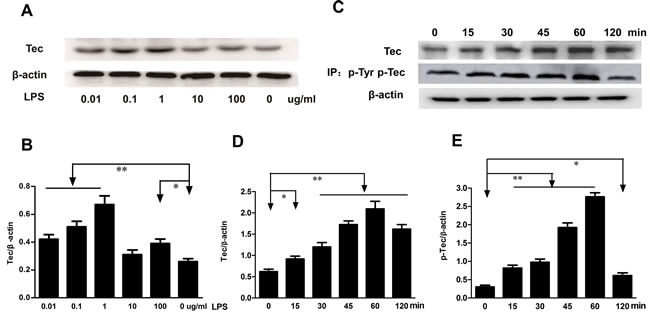
Figure 1. LPS induced the expression of Tec and phosphorylation of Tec protein.

A. The expression of Tec was detected by western blotting after LPS stimulus at different concentration (0.01, 0.1, 1, 10, 100 μg/ml). B. Quantitative analysis of Tec protein was determined by integral optical density (*P < 0.05, **P < 0.01, n = 3.). C. The expression of Tec and p-Tec was detected by Western blotting after 0.1 μg/ml LPS stimulus. Total Tec protein was immunoblotted with an anti-Tec Ab, and tyrosine phosphorylation was detected by immunoprecipitating with an anti-phosphotyrosine Ab. D.-E. The relative levels of Tec and p-Tec were quantified. 0.1 μg/ml LPS can upregulate the expression of Tec and p-Tec with a peak at 60 min. (*P < 0.05, **P < 0.01, n = 3.).
