
Figure 2. Cell death in the DG at 6 h and 24 h after irradiation.
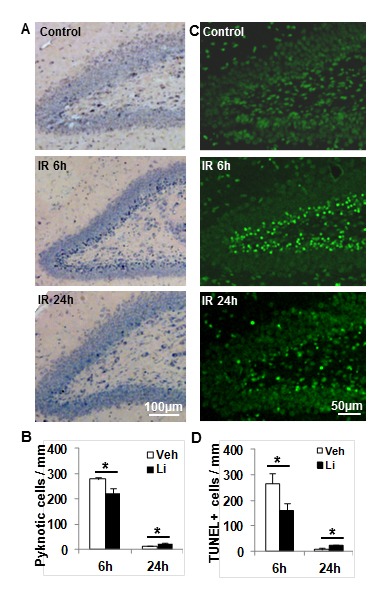
A. Representative photomicrograph of H&E staining in the DG at 6 h and 24 h after irradiation. B. The bar graph shows the quantification of pyknotic cells in the SGZ at 6 h and 24 h after irradiation in both vehicle-treated and lithium-treated rats. C. Representative TUNNEL staining in the DG at 6 h and 24 h after irradiation. D. Quantification of TUNEL-labelled cells in the vehicle-treated and lithium-treated rats after irradiation. n = 6/group for the 6 h vehicle and lithium treatment, n = 6 for the vehicle group and n = 7 for the lithium treatment group at 24 h. * p < 0.05.