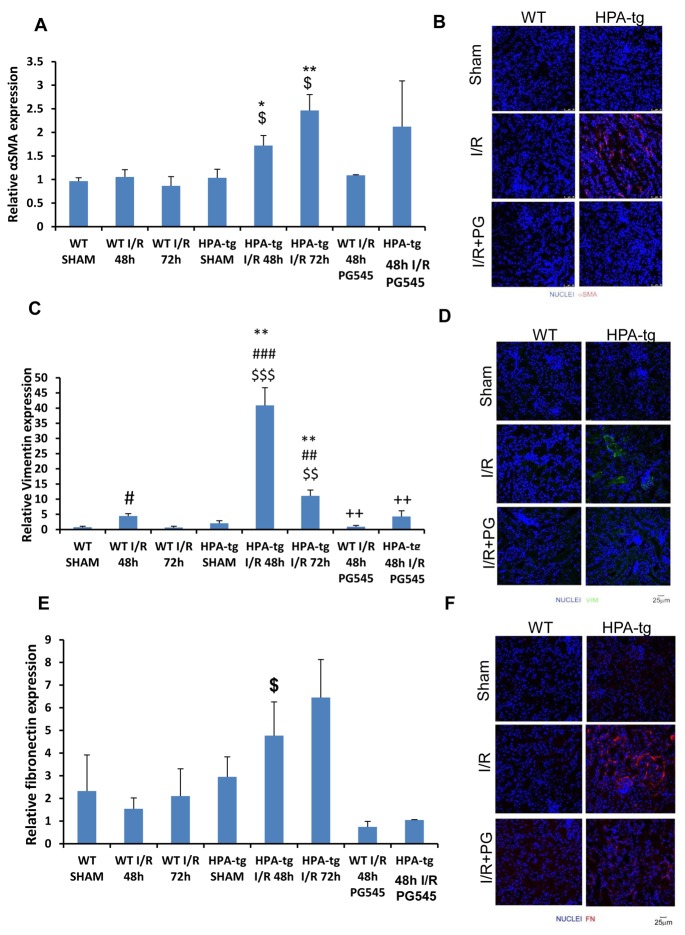
Figure 4. Expression of epithelial mesenchymal transition (EMT) markers in wt vs.
Hpa-tg mice after I/R kidney injury. Relative gene expression of A. α-SMA, C. VIM, and E. FN, were evaluated by real-time PCR in renal tissue extracts from wt and Hpa-tg mice that underwent I/R kidney injury with or without pre-treatment with PG545. Results were normalized to GAPDH expression. **p < 0.001 vs. wt SHAM mice. I/R, ischemia/reperfusion. Representative immunofluorescence staining of α-SMA B., VIM D. and FN F. in renal tissue of wt and Hpa-tg mice that underwent 48 h of I/R kidney injury with or without pre-treatment with PG545. Magnification 40x. *p < 0.05, **p < 0.01 vs. corresponding sham; #p < 0.05, ##p < 0.01 vs. corresponding group w/o I/R; $p < 0.05, $$p < 0.01 vs. corresponding wt; +p < 0.05, ++p < 0.01 vs. untreated I/R corresponding group.

