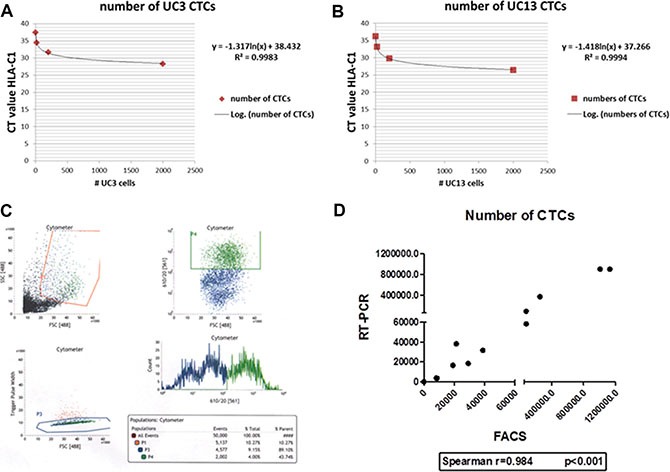
Figure 2. RT-PCR and FACS are effective methods of quantifying CTCs.

(A–B) Standard curves for RT-PCR quantification for UM-UC3 and UM-UC13 CTCs, respectively. (C) FACS plot showing identification of the CTC population (originating from UM-UC3 orthotopic tumors) in serum samples. Only the CTCs with the “strongest” signal were selected for further recycling. (D) Strong correlation (Spearman's rho = 0.984) of UM-UC3 CTC quantification between RT-PCR and FACS methods.
