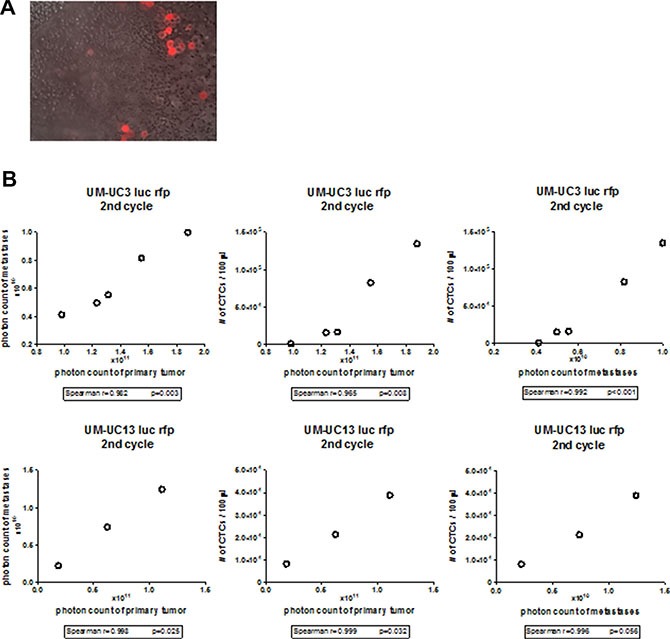
Figure 3. CTC correlates with primary and metastatic tumor burden in UM-UC3 and UM-UC13 xenografts.

(A) Fluorescence microscopy of blood smear originating from UM-UC3 xenografts. UM-UC3 cells are RFP-labeled. Magnification 40×. CTCs are seen as single cell and clumps. (B) Correlation of primary tumor size to metastasis, primary tumor size to CTCs, and metastasis to CTCs in UM-UC3 and UM-UC13 xenografts.
