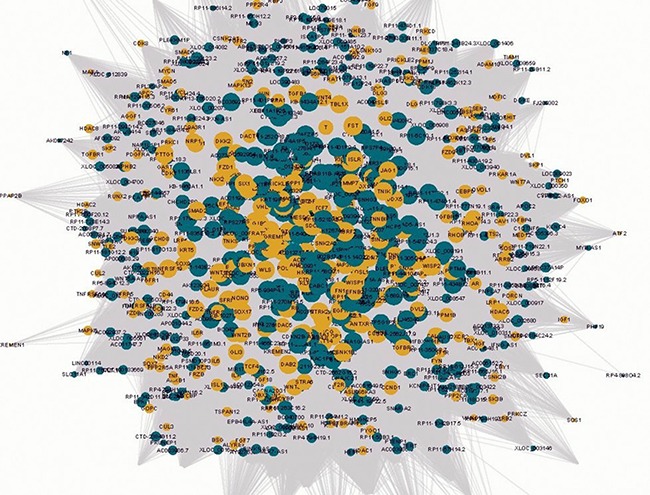
Figure 1. The visualisation of the lncRNA/Wnt gene co-expression network in Wnt pathways in keloids.

The circular yellow nodes represent the Wnt-genes, and the circular green nodes represent the Wnt-lncRNAs. The node sizes are in proportion to the number of lncRNAs interacting with Wnt genes. The solid lines and dashed lines represent positive and negative correlations, respectively.
