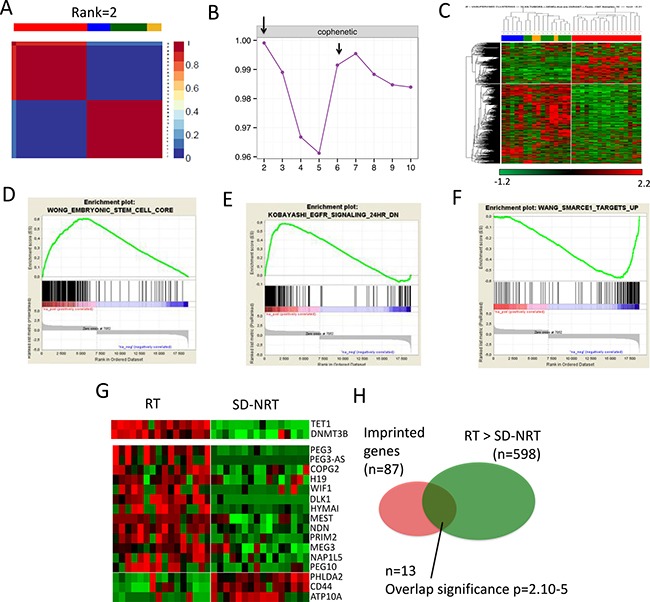
Figure 1. Comparisons between training set Rhabdoid tumors (RT) and training set SMARCB1-deficient non rhabdoid tumors (SD-NRT).

(A) Non Matrix factorization (NMF) performed on the 32 tumors and (B) cophenetic scores, showing that RT and all others SD-NRT first clusterize in two main subgroups; RT is a clearly distinct entity (C) Similar results obtained by unsupervised hierarchical clustering (D, E, F) Gene Set Enrichment Analyses showing 3 biological signatures that distinguish RT from SD-NRT, (G) heat-map showing the relative expression of TET1 and DNMT3B (upper panel) and imprinted genes (lower panels) in RT vs SD-NRT. (H) Venn diagram showing the significance of the over-representation of imprinted genes in the list of differentially expressed genes.
