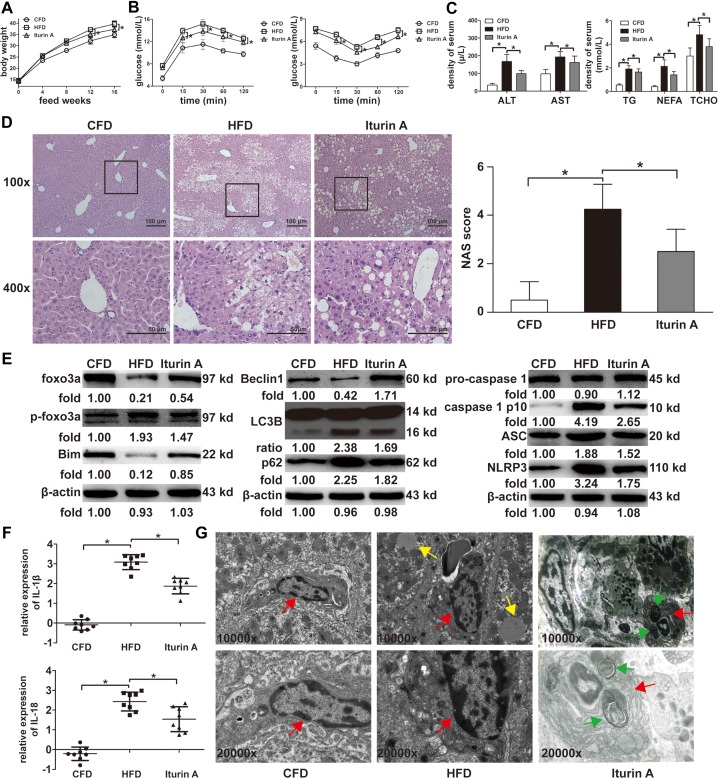
Figure 4. Effects of Foxo3a on mice feed with a HFD.
(A) Body weights in the Iturin A group were lighter compared to mice in the HFD group. (B) Glucose tolerance tests (left) in the Iturin A group were significantly better than for mice in the HFD group; insulin tolerance tests (right) in the Iturin A group were significantly better than for mice in the HFD group. (C) Serum levels of ALT, AST, TG, TCHO and NEFA were significantly lower than for mice in the HFD group. (D) Liver steatosis in the Iturin A group was more lighter compared to mice in the HFD group via H&E staining (100× and 400×); NAS scores in the Iturin A group were lower for those mice in the HFD group. (E) The ratio of LC3 II and I, the protein levels of Foxo3a, Bim, Beclin 1, the NLRP3 inflammasome and ACS, as well as caspase-1 separated from pro-caspase-1, in KCs isolated from mice in the Iturin A and HFD groups were evaluated via WB assay. (F) The mRNA expression of IL-1β and IL-18 in KCs isolated from mice in the Iturin A and HFD groups were evaluated using RT-PCR assay. *p < 0.05. (G) Autophagosomes of KCs were observed by TME in mice treated with Iturin A. (red arrow indicates KCs, yellow arrow indicates lipid droplets and green arrow indicates autophagosomes). (TME, 10000× and 20000×).

