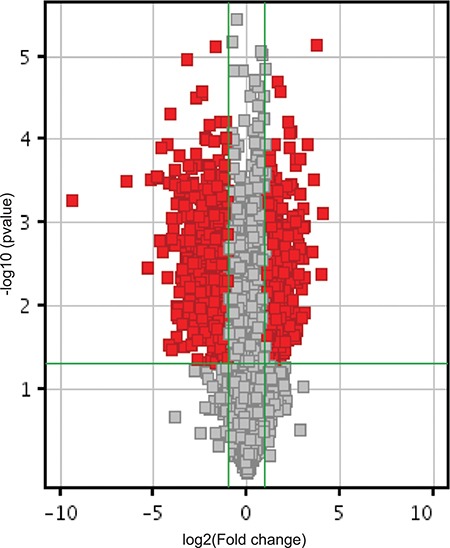
Figure 2. RASSF1C piRNA target gene expression.

Volcano plot shows piRNA differential expression in lung cancer cells over-expressing RASSF1C and controls using fold-change values and P-values. The vertical green lines correspond to 2.0-fold up and down, respectively, and the horizontal green line represents a P-value of 0.05. The red points in the plot represent the differentially expressed piRNAs with statistical significance. Over 500 piRNAs that are either up-regulated or down-regulated by RASSF1C are present in the lung cancer cell line H1299.
