
Figure 4. Expression profiling of selected piRNAs in lung tumors.
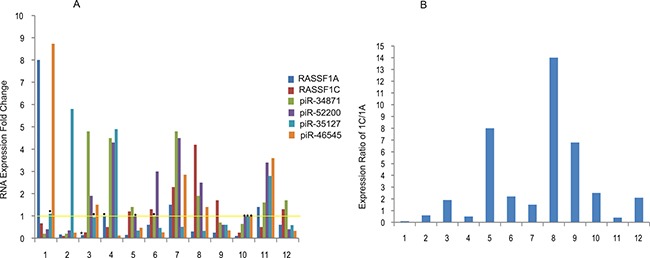
(A) Expression of RASSF1C, RASSF1A, and selected piRNAs was assessed in lung tumor samples by RT-PCR using gene-specific primers. RASSF1C expression is higher in 6 of 12 tumor samples and RASSF1C expression appears to negatively correlate with that of piR-35127 in 10 of the 12 tumor samples tested. The yellow line represents normalized basal piRNA expression in control samples and thus experimental values above the line represent elevated expression and values below the line represent reduced expression of the piRNA expression. The RT-PCR of control and experimental reactions were run in triplicates in multiple independent runs and the 2-ΔΔmethod was used to perform statistical analysis (32). The expression fold change (bars) are statistically significant (P < .05) compared to controls except those bars with dot (٠) placed on top. (B) The ratio of RASSF1C to RASSF1A expression was assessed in 12 lung tumor samples. The ratio of RASSF1C to RASSF1A was > 1 in 8/12 (67%) of lung tumors. The ratio was calculated by dividing [RASSF1C expression in tumor tissue/RASSF1C in normal tissue] by [RASSF1A expression in tumor tissue/RASSF1A in normal tissue].