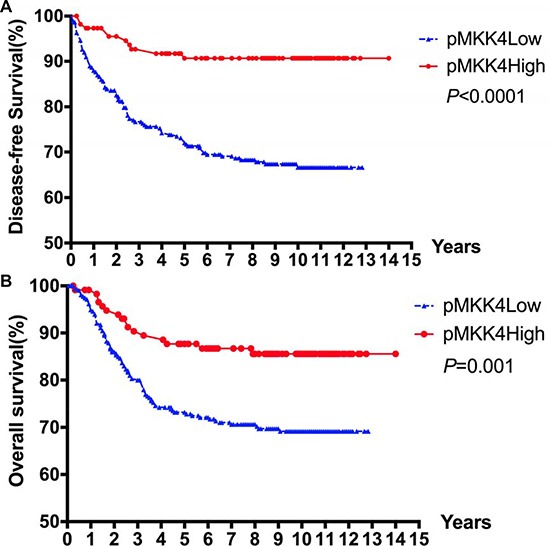
Figure 2. Kaplan–Meier survival curves for DFS.

(A) and OS (B) according to pMKK4 High score and Low score of patients with CRC. The 1, 5 and 10-year DFS rates in pMKK4 high score group and low score group were 97.4% VS. 88.0%, 90.7% VS. 71.3%, and 90.7% VS. 66.6%, accordingly. The 1, 5 and 10-year OS rates in pMKK4 high score group and low score group were 98.3% VS. 94.9%, 86.7% VS. 72.8%, and 85.6% VS. 71.8%, accordingly. The pMKK4 high score group showed a significant better DFS and OS than those of the pMKK4 low score group.
