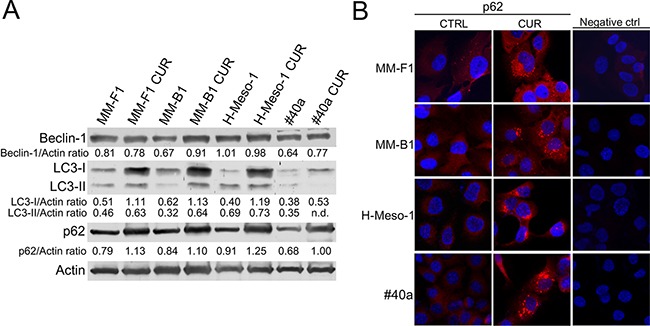
Figure 3. Effect of CUR on the autophagic flux in MM cells.

Panel A. The expression of Beclin-1, LC3-I and LC3-II, and p62 was assessed by western blotting in MM cell lines treated with CUR at 25 μM or DMSO for 24 hours. Actin was used as an internal control. The intensity of the bands was quantified using the ImageJ software after blot scanning of two independent experiments. The densitometric ratios between Beclin-1 and actin, LC3-I and actin, LC3-II and actin, p62 and actin are reported. Panel B. The expression of p62 after treatment with CUR in MM cells was determined by immunofluorescence analysis. Cells were fixed after treatment, and incubated with the anti-p62 antibody. After two washes with PBS, cells were incubated with the secondary Alexa fluor-594-conjugated goat anti-rabbit IgG antibody. Nuclei were stained with Hoechst. Original magnification x400. n.d= not detectable.
