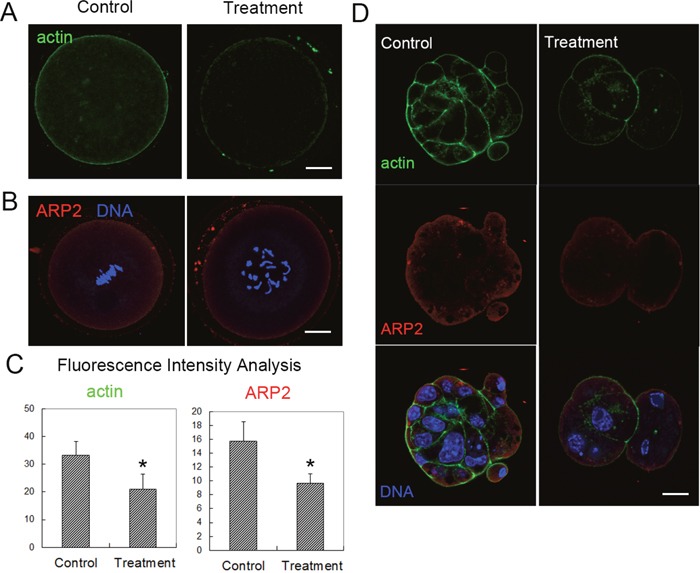
Figure 2. Citrinin toxin exposure affected actin filament dynamics in mouse oocytes and embryos.

(A) Actin distribution was disrupted after citrinin toxin exposure. Actin, green. (B) ARP2 fluorescence intensities were reduced in citrinin toxin treated oocytes. ARP2, red; DNA, blue. Bar = 20 μm. (C) Average actin and ARP2 fluorescence intensity analysis in mouse oocytes. *, significantly different (p < 0.05). (D) Actin distribution and ARP2 was disrupted after citrinin toxin exposure in mouse embryos. Actin, green; ARP2, red; DNA, blue. Bar = 20 μm.
