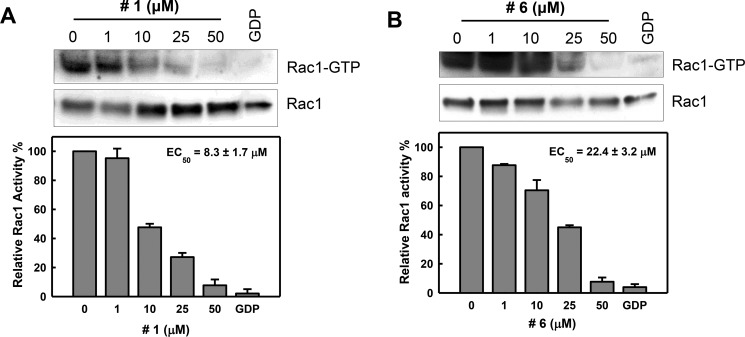
Figure 3. Inhibition of Rac1 activity in cells by compounds #1 and #6.
CD18/HPAF cells were serum starved in the medium containing 0.3% FBS for 24 h, incubated for 2 h in the presence of compound #1 (A) or #6 (B) at the indicated concentrations and then stimulated with EGF (100 ng/ml) for 5 min. Upper panels: level of Rac1-GTP and total Rac1 in the samples were determined by Rac1 activity assay and immunoblotting, respectively. Lower panels: immunoblot densities of Rac1-GTP and Rac1 were quantified using ImageJ software and relative Rac1 activity versus total Rac1 was determined. The obtained data were fitted using a nonlinear least squares fit to a single site-binding model to determine the EC50. Results are shown as mean ± S.D. of two sets of experiments.

