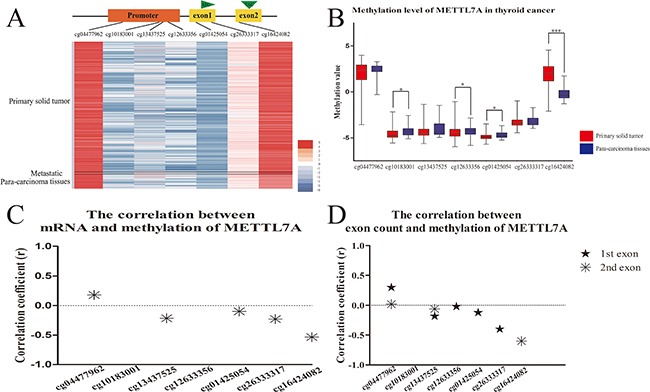
Figure 1. DNA methylation level of METTL7A in thyroid cancers in vivo.

(A) The heatmap of DNA methylation patterns of METTL7A in thyroid cancer patients from TCGA database. The methylation level from high to low represents red to blue. Black lines divide all the samples into three parts of primary tumor, metastatic tumor and control tissues. (B) Analysis of methylation level of METTL7A between thyroid cancer and control tissues. METTL7A related methylation probe names from promoter to gene body were listed on the horizontal axis. (C) The correlation between mRNA and mthylation level of each probe of METTL7A. The correlations of METTL7A mRNA level and methylation value of each probe were calculated separately using Pearson analysis. Positive and negative correlation coefficients which had statistical significance (p<0.05) were plotted by asterisk above and below 0 respectively. (D) The correlation between exon count and mthylation level of each probe of METTL7A. The correlations of METTL7A first and second exon count and methylation value of each probe were calculated separately using Spearman analysis. Positive and negative correlation coefficients which had statistical significance were plotted by stars above and below 0 respectively.
