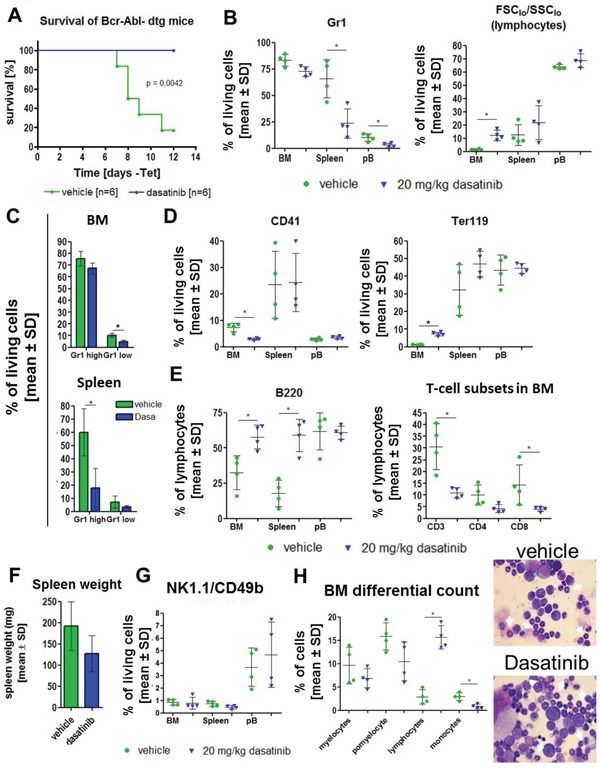
Figure 3. Dasatinib treatment of primary induced mice results in prolonged survival of dtg animals and a reversion of the disease phenotype.

Expression of BCR-ABL was induced for 1 day by withdrawal of tetracycline from the drinking water of stg (control, BCR-ABL negative) and dtg (BCR-ABL positive) mice. (A) Kaplan-Meier survival curve of induced double transgenic (dtg) mice receiving either vehicle control (green) or dasatinb (blue). (B) Based on the rapid disease onset in the dtg mice, we induced 8 dtg animals for 1 day and subsequently treated for 9 days with 20 mg/kg dasatinib (blue triangle) or vehicle control (green circle) by oral gavage (n=4/group). Evaluation of granulocytes (Gr1) and lymphocytes (% of FCSlow/SSClow) in the bone marrow (BM), spleen and peripheral blood (pB). Depicted are the percentages of living cells. (C) Analysis of the amount of mature (Gr1 high/CD11b+) and immature (Gr1 low/CD11+) granulocytes in the BM and spleen gated on living cells. (D) Percentage of megakaryocytes (CD41) and erythroid cells (Ter119) in BM, spleen and pB. (E) Analysis of lymphocytes by staining for B220 (B cells) and CD3, CD4 and CD8 (T cells). Shown are the percentages of lymphocytes (FCSlow/SSClow). (F) Total spleen weight of vehicle treated and dasatinib treated dtg mice. (G) Effect of dasatinib on CD49b/NK1.1 double positive NK cells in the BM, spleen and blood. (H) Microscopic evaluation of 200 cells in bone marrow smears support the FACS data by showing a decrease of myelocytes, promyelocytes (white arrows) and monocytes and a significant increase in lymphocytes after dasatinib gavage. Shown are two representative Pappenheim stainings from a vehicle treated mouse (upper picture) and a dasatinib treated mouse (lower picture) (100x magnification). All data are shown as mean ± SD. *p < 0.05.
