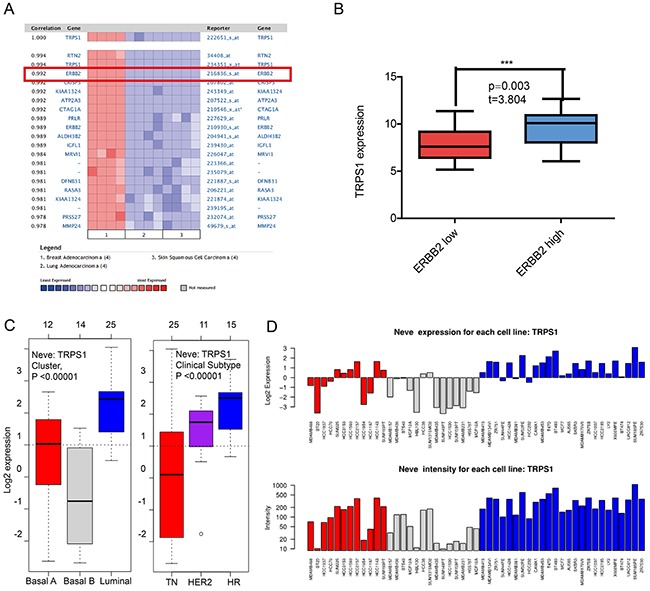
Figure 5. The correlation analysis of GATA3 in different molecular subtypes of breast cancer.

(A) In ONCOMINE analysis, TRPS1 expression was significantly correlated with ERBB2 expression. (shown in red frame) (B) In CCLE analysis, TRPS1 over-expressed in the breast cancer cell lines with high level of ERBB2 expression, while under-expressed in those with low level or negative ERBB2 expression. (C) In GOBO analysis, the expression of TRPS1 in different subtypes of breast cancer (E) the expression of TRPS1 in each cell lines.
