
Figure 4. Decreased inflammation in AOM/DSS Cysltr1−/− colons with less infiltration of immune cells and increased expression of Mucin 2.
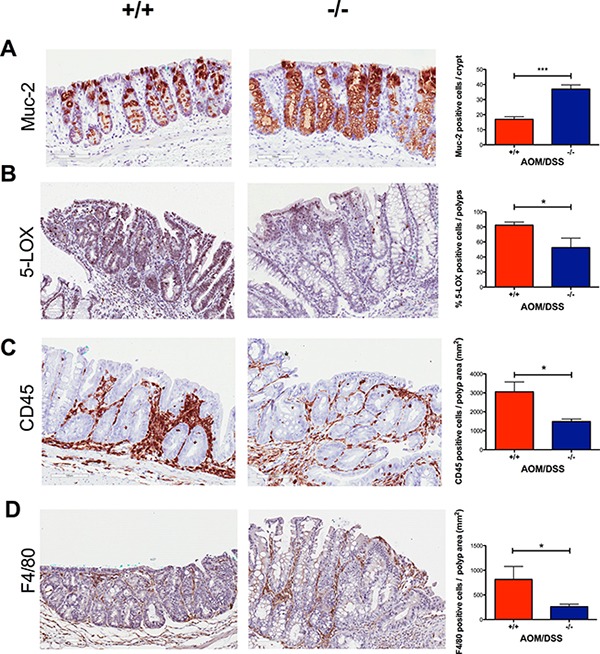
Representative images (20×) of colonic crypts stained with (A) mucin 2, and colonic polyps stained with (B) 5-LOX, (C) CD45, and (D) F4/80 with their corresponding bar diagrams showing (A) mucin 2 positive cells per normal crypt, (B) the percentages of 5-LOX positive cells, (C) CD45 positive cells per polyp area (mm2) and (D) F4/80 positive cells per polyp area (mm2). Quantitative data are shown as the mean ± SEM, where n = 2–6 per genotype. *P < 0.05, ***P < 0.001 by t-test or Mann-Whitney test.