Figure 2.

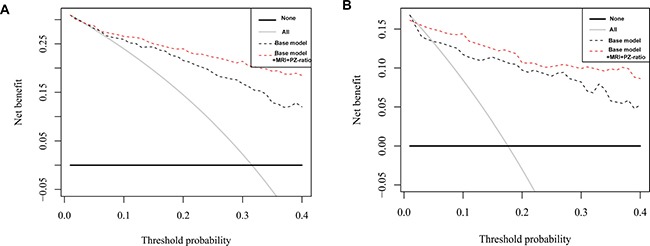
Decision curve analysis of predicting significant PCa with base model vs. base model + MRI + PZ-ratio in all PSA group (A) and patients with PSA of 4–10 ng/ml (B).

Decision curve analysis of predicting significant PCa with base model vs. base model + MRI + PZ-ratio in all PSA group (A) and patients with PSA of 4–10 ng/ml (B).