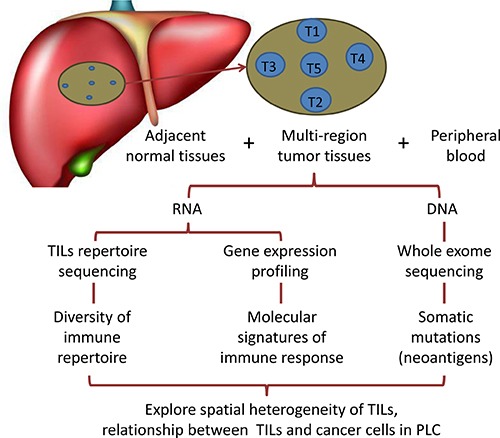
Figure 1. Schematic diagram of study design.

The brown circle on behalf of the lesions, and the position of blue circles represent spatial distribution of five tumor specimens (T1–T5) from the same tumor.

The brown circle on behalf of the lesions, and the position of blue circles represent spatial distribution of five tumor specimens (T1–T5) from the same tumor.