
Figure 2. The correlation coefficient of the duplicate sample of each tumor region from patient 4.
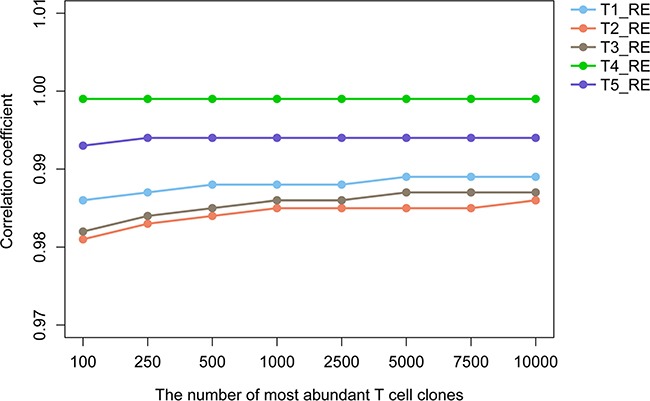
The y-axis shows the specific numerical of correlation coefficient, x-axis shows the group with various amounts of abundant T cell clones.
Official websites use .gov
A
.gov website belongs to an official
government organization in the United States.
Secure .gov websites use HTTPS
A lock (
) or https:// means you've safely
connected to the .gov website. Share sensitive
information only on official, secure websites.
The y-axis shows the specific numerical of correlation coefficient, x-axis shows the group with various amounts of abundant T cell clones.