
Figure 3. The distribution characteristics of the TCRβ repertoires in tumor tissues, adjacent normal tissues and peripheral blood.
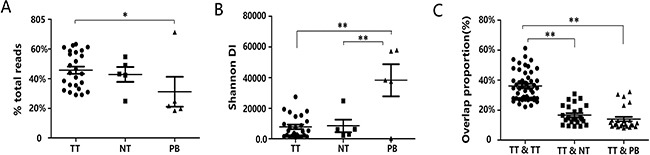
(A) The cumulative frequency of the TOP250 in tumor tissues, adjacent normal tissues and peripheral blood. Data points represent the cumulative frequency of the TOP250 of each sample from five patients, and bars depict the mean (± SEM) of the groups. Differences between groups were compared using one-way ANOVA. *P = 0.039. TT, NT and PB represent tumor tissues, adjacent normal tissues and peripheral blood, respectively. (B) Data show the distribution of TCR diversity by measuring the shannonDI. Each dot represents the shannonDI of each sample, and bars show the mean (± SEM) of the groups. Differences between groups were compared using one-way ANOVA. **P < 0.001. (C) Data show the overlap of clonotypes between sample groups, TT and TT, TT and NT, TT and PB. Each dot represents the overlap rate between any two samples, and bars show the mean (± SEM) of the groups. Differences between groups were compared using one-way ANOVA. **P < 0.001.