
Figure 4. Comparison of the pairwise overlap of TCRβ repertoire between different samples of each patient.
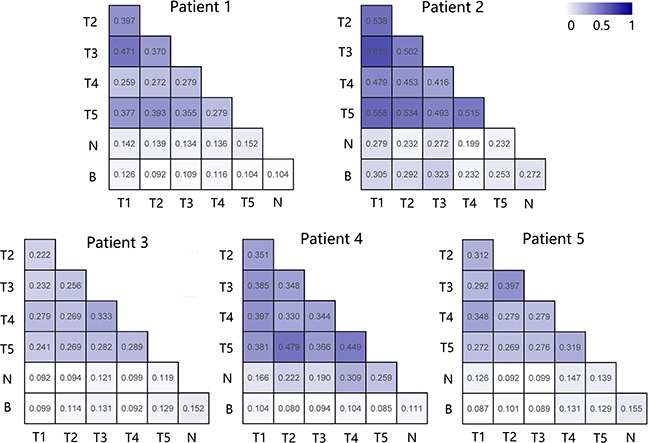
For each patient we computed pairwise overlaps among all samples, the high overlap rate obtain a darker shade of blue in the heat map. Sample names T, N and B represent tumor tissues, adjacent normal tissues and peripheral blood, respectively.