
Figure 7. The relationship between local TCR clone diversity and the immune status.
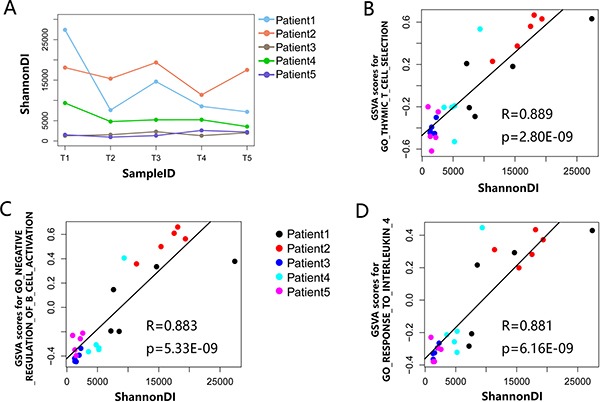
(A) The ShannonDI for each tumor sample of five PLC patients. (B–D) Correlations between ShannonDI values and GSVA score of three GO gene sets list in Table 2 that achieved the largest correlation coefficient in the tumor samples of five PLC patients. The best-fit lines are indicated on each panel, each dot represents an individual tumor region.