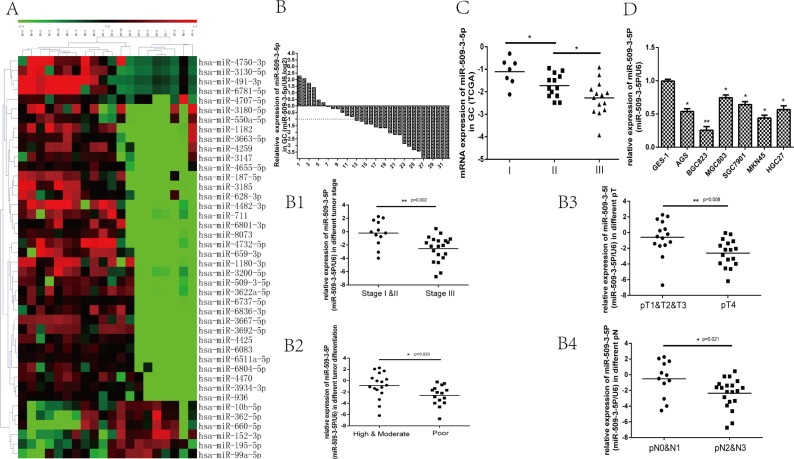
Figure 1. The potential differential expressed miRNAs between N0 and N3 group, and the expression of miR-509-3-5P in fresh GC tissues, the Cancer Genome Atlas (TCGA) database and GC cell lines.
(A) The potential differential expressed miRNAs (increase or decrease at least 2-fold, p < 0.05) between N0 and N3 group screened by miRNA microarray. (B) the expression of miR-509-3-5P in 32 GC tissues and adjacent normal tissues was determined by qRT-PCR. MiR-509-3-5P expression was observed to be decreased in 26 (81.25%) GC tissues. The logarithmic scale 2−ΔΔCt was applied for the analysis. B1-B4. The correlations between miR-509-3-5P and tumor stage, differentiation, pT stage, pN stage in 32 fresh GC tissues. (C) The TCGA data showed that miR-509-3-5P level was decreased gradually in stage I, stage II, stage III. (D) miR-509-3-5P expression in six different GC cell lines in contrast with normal human gastric epithelial cells-1 ( *p < 0.05, **p < 0.01).

