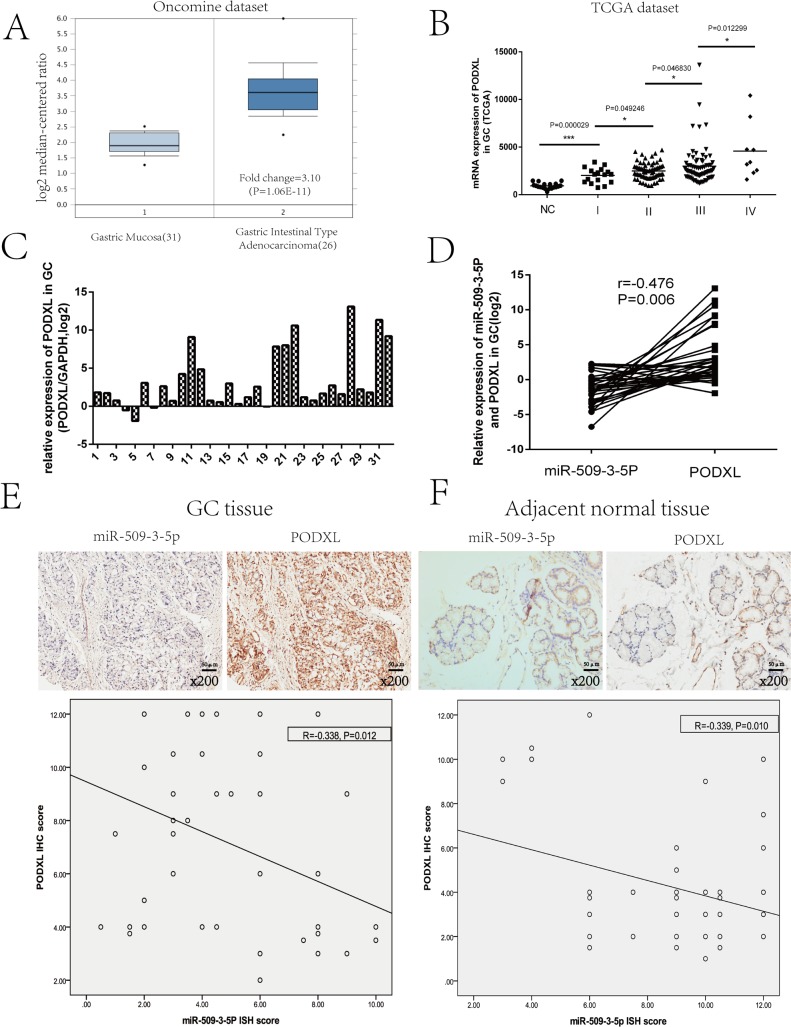
Figure 5. Analysis of PODXL expression in GC based on the Oncomine and TCGA database, and the correlation between miR-509-3-5P and PODXL GC.
(A) Exhibition of PODXL mRNA expression in GC tissues and normal tissues from Oncomine database (DErrico, 2009). (B) TCGA dataset showed that PODXL level of GC was increased in advanced tumor stage as compared with normal tissues. (C) The mRNA expression of PODXL was detected by quantitative real-time PCR(qRT-PCR) in 32 fresh GC tissues as compared to adjacent normal tissues. The logarithmic scale 2−ΔΔCt was applied for the analysis. (D) Representative image of the correlation between miR-509-3-5P and PODXL mRNA expression in 32 GC tissues (Pearson's correlation analysis, r = −0.476, p = 0.006). (E–F) The relationship between miR-509-3-5P and PODXL in GC tissues microarray was determined by Pearson's correlation. Negative correlations were observed in GC tissues (r = −0.338, p = 0.012) and adjacent normal tissues (r = −0.339, p = 0.010).

