
Figure 1. Effect of TMZ and JIB 04 on native GB primary cultures and cell lines.
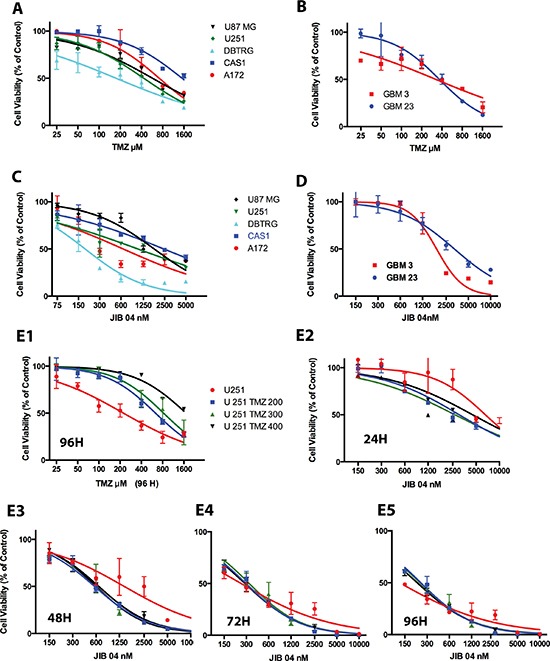
(Panel A) Activity of TMZ on a panel of GB cell lines measured by MTS. Each point represents the mean value of three replicates. Treatment time: 72 hours. IC50 values were: A172 731μM; CAS1 1544 μM; DBTRG 175 μM; U87 MG 573 μM; U251 431 μM. (Panel B) Activity of TMZ on stem-enriched GB cells primary cultures measured by MTS. Treatment time: 72 hours. Each point represents the mean value of three replicates. IC50 values were: GBM3 324 μM; GBM 23 356 μM. The statistical significance of the effect of TMZ on cell viability (Panels A and B) is reported in Supplementary Table 1A. (Panel C) MTS analysis of GB cell lines exposed for 48 hours to JIB 04. Each point represents the mean value of three replicates. IC50 values were: A172 647 nM; CAS1 2400 nM; DBTRG 186 nM; U251 1047 nM; U87 MG 1784 nM. (Panel D) MTS analysis of patient's-derived GB primary culture exposed for 96 hours to JIB 04. Each point represents the mean value of three replicates. IC50 values: GBM 3 1860 nM, GBM 23 3200 nM. The statistical significance of the effect of JIB 04 on cell viability (Panels C and D) is reported in Supplementary Table 1B. (Panels E1–E5) RealTime-Glo MT analysis of U251 cells exposed to TMZ or JIB 04. U251 TMZ 200, TMZ 300 and TMZ 400 are U251 cells made resistant to TMZ after growth in 200, 300 or 400 μM TMZ. Each datapoint represents the average of three replicates and two separate experiments. IC50 values and significance of the observed differences is reported in Supplementary Figure 1, Panels 1B and 1C.