
Figure 5. Synergy between JIB 04 and TMZ.
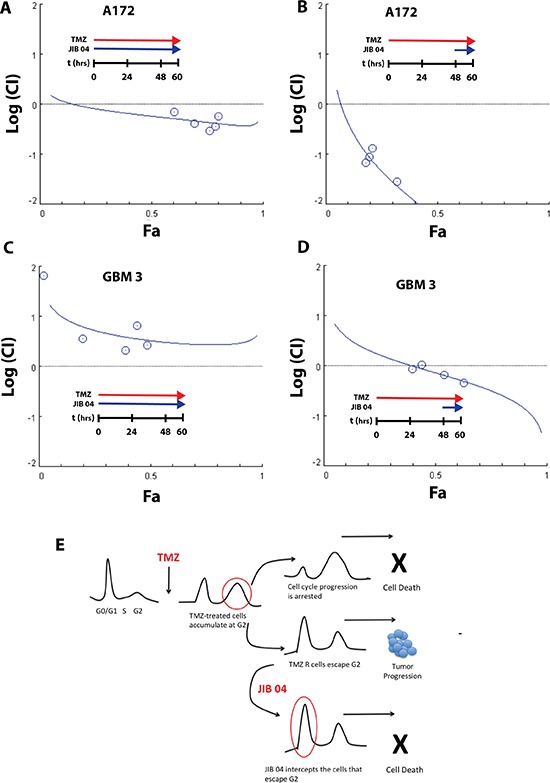
(Panel A) Plot of the log(CI) index vs. the effect (Fa) of JIB 04 treatment of A172 cells. The effect considered was the induction of apoptosis measured by Annexin V staining. Each data point represents the mean of duplicate analysis. Cells were incubated for 60 hours with a constant ratio of the two molecules (JIB 04 = 1; TMZ = 500). The plot of the CI indicates a moderate synergy between the two molecules. (Panel B) same as Panel A except that the cells were incubated for 48 hours with TMZ alone, and for 12 hours with TMZ and JIB 04. The ratio between JIB 04 and TMZ was the same of Panel A. The plot of the CI indicates a very strong synergy between the two molecules. (Panel C) Plot of the log(CI) index vs the effect (Fa) of JIB 04 treatment on GBM 3 primary GB cultures. The effect considered was the cell vitality measured by MTS. Each data point represents the men of triplicate analysis. Cells were incubated for 60 hours with a constant ratio of the two molecules (JIB 04 = 1; TMZ = 500). The plot of the CI indicates a modest to moderate antagonism between the two molecules. (Panel D) same as Panel C except that the cells were incubated for 48 hours with TMZ alone, followed by 12 hours with TMZ and JIB 04. The ratio between JIB 04 and TMZ was the same of Panel C. The plot of the CI indicates an additive effect at the lowest concentration and moderate synergy between the two molecules at higher concentrations. (Panel E) Working hypothesis on the mechanism of the combined effect of JIB 04 and TMZ. TMZ blocks the cell cycle at the G2 checkpoint. The cells that acquire TMZ resistance can pass G2 and resume proliferation. JIB 04 target these cycling cells cooperating with TMZ (see also Supplementary Figure 4 for the effect of JIB 04 on cell cycle).