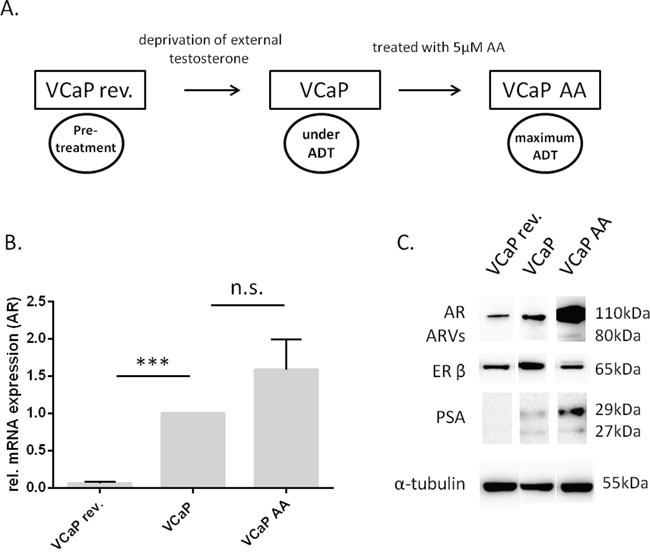
Figure 1. The VCaP variants differ in their expression of prostate cancer-relevant genes.

(A) VCaP rev were cultured with 1 nM testosterone over seven months, whereas VCaP AA were treated continuously with 5 μM abiraterone acetate. The three cells lines represent three different levels of androgen deprivation: VCaP rev, no therapy, subphysiological testosterone (0.3 ng/ml); VCaP, CRPC under first-line therapy (no detectable testosterone, data not shown); VCaP AA, CRPC under maximal, including intratumoral, ADT. (B) mRNA expression of the AR was measured by quantitative RT-PCR in all VCaP cell variations. AR expression in VCaP rev cells was significantly lower compared with that in VCaP control cells. AR mRNA expression in VCaP AA cells was not significantly higher than in VCaP control cells. The experiment was performed in triplicate. * P<0.05, ** P<0.01, *** P<0.0001, n.s. (not significant) compared with VCaP cells. (C) Representative western blot showing the three VCaP populations, VCaP rev, VCaP, and VCaP AA. Total protein was extracted, and immunoblots were probed with AR-specific, ERβ-specific, and PSA-specific antibodies. In VCaP rev cells, AR and PSA expression levels were remarkably lower than in VCaP cells. In VCaP AA cells, the AR and PSA expression levels were increased compared with those in VCaP cells. In VCaP rev as well as in VCaP AA cells, the ERβ expression was lower than in VCaP cells. The data represent two independent experiments, which were performed in duplicate. α-tubulin was used as a loading control.
