
Figure 2. DNA methylation and expression levels of Dnmt1o and Dnmt1s in IVF and SCNT embryos.
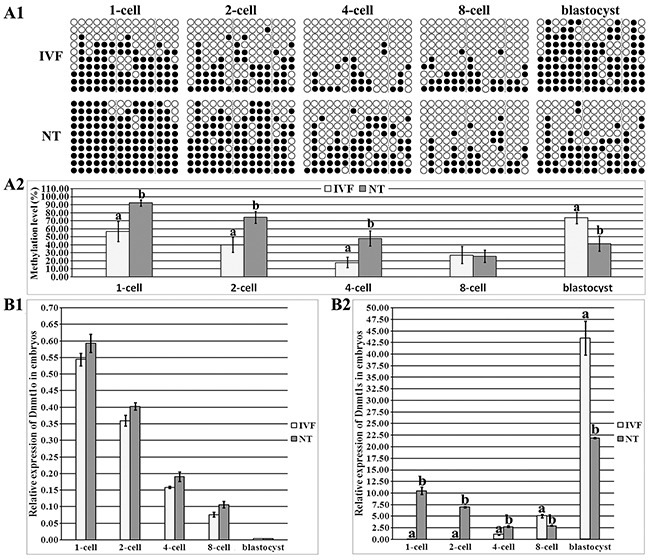
(A1), the methylation statuses of Dnmt1 at 1-cell, 2-cell, 4-cell, 8-cell and blastocyst stages of IVF and SCNT embryos, (A2), the methylation levels of Dnmt1 in the IVF and SCNT groups, (B1), relative Dnmt1o transcripts at the 1-cell, 2-cell, 4-cell, 8-cell and blastocyst stages of IVF and SCNT embryos, and, (B2), relative Dnmt1s expression in the IVF and SCNT groups. SCNT embryos displayed incomplete reprogramming of Dnmt1s methylation and expression. Black or white circles indicate methylated or unmethylated CpG sites, respectively. The transcript abundance in MII oocytes (B1) or IVF 4-cell embryos (B2) was considered to be the control. The data were expressed as mean ± SEM. a-b Values at a given stage with different superscripts differ significantly (P<0.05).