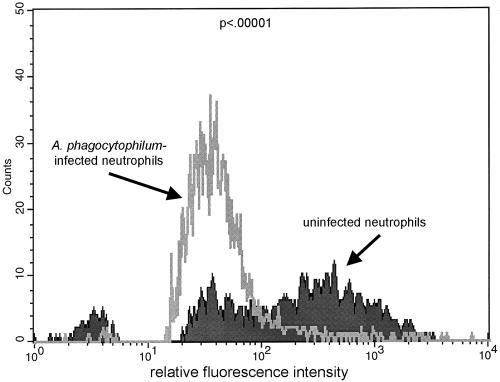
FIG. 2.
Flow cytometric analysis of uninfected and A. phagocytophilum-infected neutrophils after phagocytosis of PKH2-PCL fluorescent aggregates. As phagocytic activity increases, so does the fluorescence intensity of phagocytic cells; defective phagocytosis is indicated by reduced fluorescence intensity compared with that of uninfected control neutrophils. Note two populations among the uninfected cells, one of which demonstrated increased fluorescence corresponding to actively phagocytic cells. A. phagocytophilum-infected neutrophils had a significantly lower fluorescence mean value and distribution (P < 0.005). The histogram shown is representative of the results of three repeated experiments.

