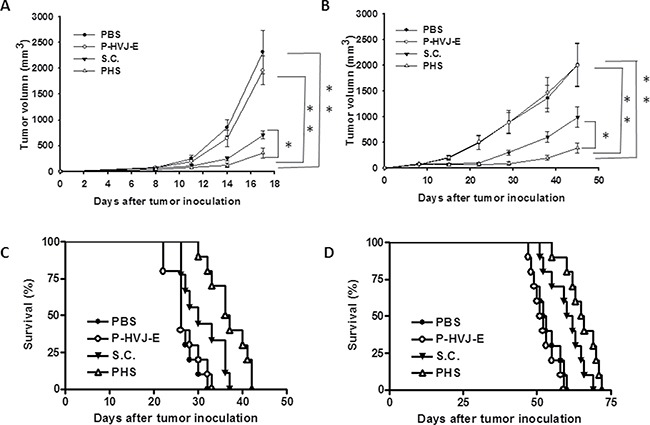
Figure 9. PAH inhibited tumor growth after systemic treatment.

The B16F10 (A) and PC3 (B) tumor volumes were measured every 3 days or 7 days after various treatments. This experiment was repeated with similar results. (Salmonella; S.C.) (n = 10, mean ± SEM. *P < 0.05; **P < 0.01). Kaplan-Meier survival curves of mice bearing (C) B16F10 and (D) PC3 tumors with different treatments are shown. Data were analyzed by the log-rank test. (P < 0.01 for PAH versus PBS and HVJ-E; P < 0.05 for S.C. versus PBS and PHS versus S.C.)
