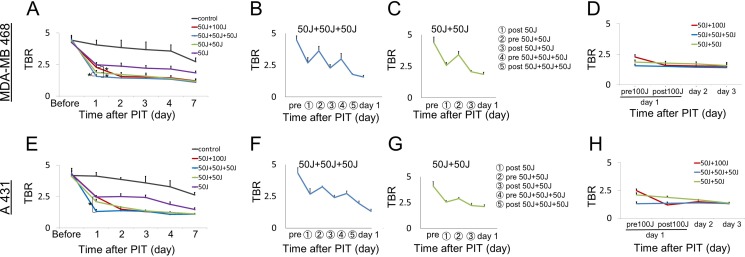
Figure 2. Quantitative analysis of IR700 fluorescence intensities in MDA-MB468luc tumors (A–D) and A431luc tumors (E–H).
(A, D, E, H) The fluorescence intensity on day 1 significantly decreased in proportion to the total light dose in treated groups due to photobleaching but then increased again due to enhanced leakage of non-irradiated circulating APC into the tumor. However, there were no significant differences in the intensity on day 2 among the groups receiving multiple NIR light exposures (50 J/cm2 + 50 J/cm2, 50 J/cm2 + 50 J/cm2 + 50 J/cm2, 50 J/cm2 + 100 J/cm2). The fluorescence intensity gradually decreased at seven days after the last NIR-PIT due to excretion of the APC. (B, C, F, G) The fluorescence intensity after each NIR light exposure dramatically changed with intensities decreasing after every NIR light exposure. Data are means ± SEM. n = 5 in each group. *P < 0.05 versus the other group.

