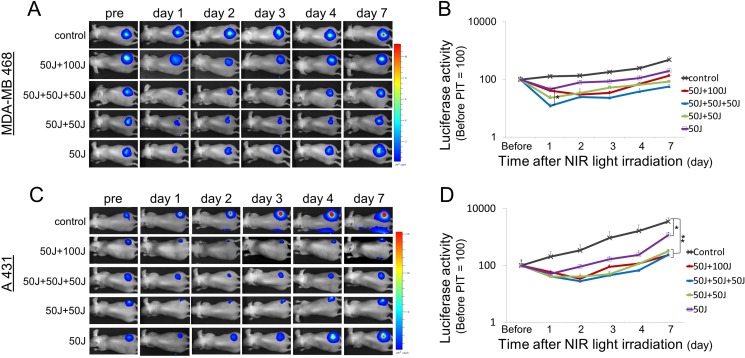
Figure 3. Bioluminescence imaging in MDA-MB468luc tumors and A431luc tumors.
(A, C) In all the treated groups the signal significantly decreased one day after each NIR light exposure and then gradually increased due to tumor regrowth. (B, D) Quantitative analysis of bioluminescence signals in MDA-MB468luc tumors (B) and A431luc tumors (D). Data are means ± SEM. n = 5 in each. *P < 0.05, **P < 0.005 versus the other group. Although there was a significant difference only between 50 J/cm2 and 50 J/cm2 + 50 J/cm2+ 50 J/cm2 on day 1 (B), the signal in the groups with repeated NIR light exposures showed a tendency to decrease as a function of light dose.

