
Figure 3. Flow cytometric analysis of EGFR and HER-2 expression.
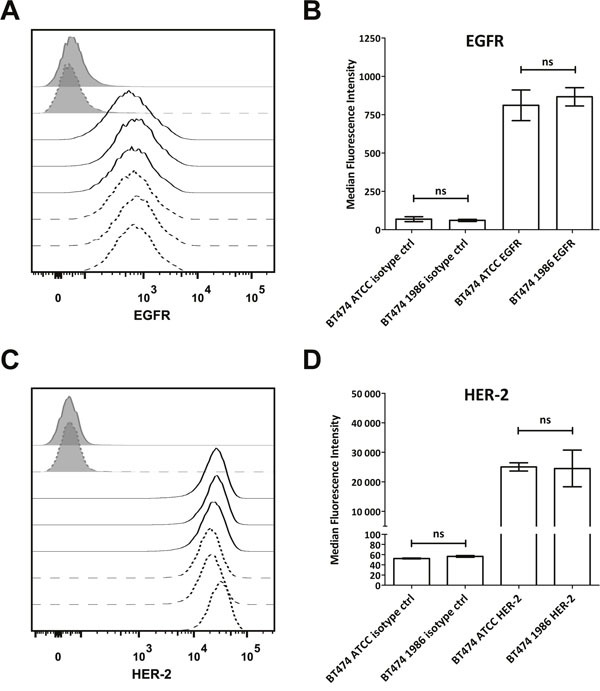
(A) Both BT474 cell batches display comparable, moderate EGFR expression as detected with cetuximab. Isotype controls are displayed as full grey histograms, cetuximab stainings as lines. Full lines indicate BT474 ATCC cells and dashed lines indicate BT474 1986 cells. (B) Statistical readout of flow cytometric experiments shown in (A). Bars depict median fluorescence intensity ± standard deviation. No statistically significant differences could be observed between the two investigated BT474 cell lines with regard to EGFR expression. (C) BT474 ATCC and BT474 1986 express high levels of HER-2, detected with trastuzumab. Isotype controls are displayed as full grey histograms, trastuzumab stainings as lines. Full lines indicate BT474 ATCC cells and dashed lines indicate BT474 1986 cells. (D) Statistical readout of flow cytometric experiments shown in (C). Bars depict median fluorescence intensity ± standard deviation. Again no statistically significant differences could be observed between the two investigated BT474 cell lines with regard to HER-2 expression.