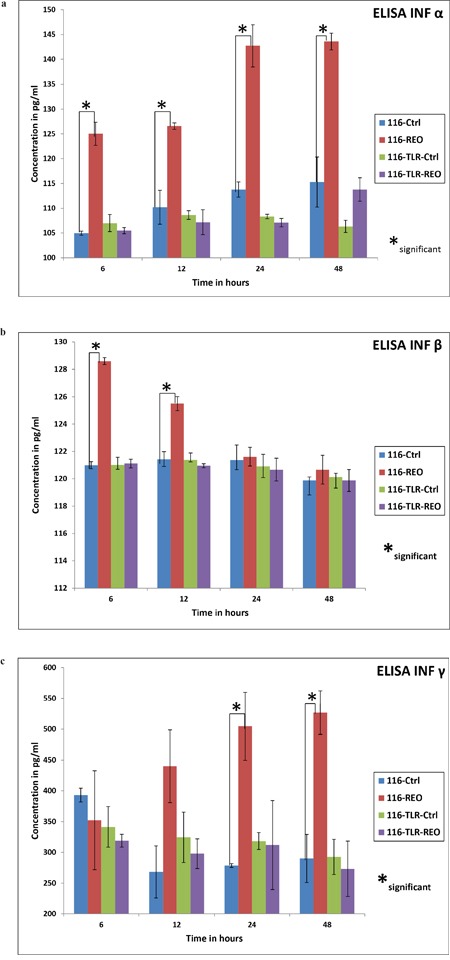
Figure 4.

The ELISA for IFN-α,-β and -γ are shown in order in three graphs (a), (b) & (c). TLR-3 down regulated cells showed no increase in release of the soluble cytokines upon reovirus infection at a dose of 5 MOI. On the contrary, HCT116 control cells did show a rise in release of the three classes of interferons upon reovirus infection at 5 MOI. In case of IFN-α there was a significant increase (p≤ 0.05) of cytokine productions at all 4 time points namely 6, 12, 24 and 48 hours as represented by *. In case of IFN-β the significance (p≤ 0.05) was observed in control cells treated and untreated at 6 and 12 hours where as the IFN-γ showed a significant difference in the same group at 24 and 48 hours.
