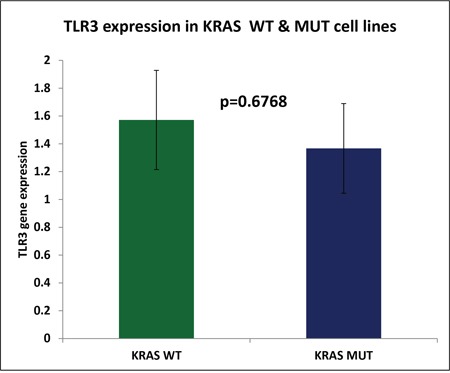
Figure 5. Represents the average TLR3 expression of KRAS wild type cell lines (n=23) and KRAS mutant CRC cell lines (n=33) as measured by RNA sequencing analysis.

The difference in TLR3 expression was determined to be insignificant (p=0.6768).

The difference in TLR3 expression was determined to be insignificant (p=0.6768).