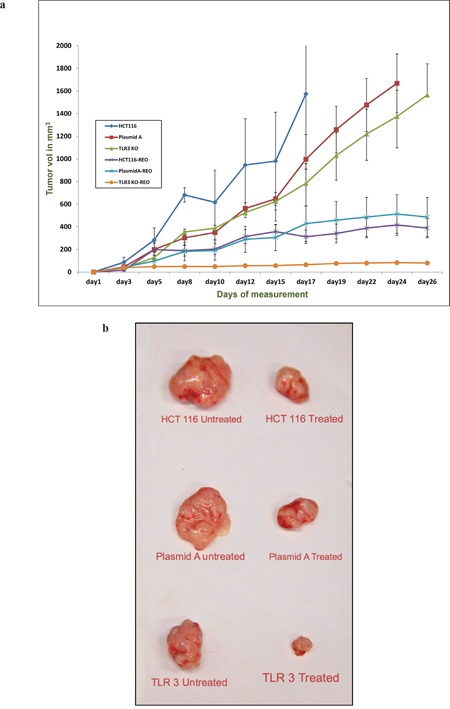
Figure 6.

(a) The graph represents the mean tumor volume of each of the six group of animal namely HCT116, HCT116-plasmid A, HCT116 TLR3 knockout (KO) and reovirus treated versions of the aforementioned cell line derived xenografts (n=4). The tumors were measured thrice a week and a total of 12 measurements were taken. Day 1 represents the initiation of reovirus treatment. All animals were alive till the end point of experiment. (b) The photograph of representative excised tumors from each of the six groups showing the comparative tumor size growth inhibition upon reovirus treatment at the endpoint of the study.
