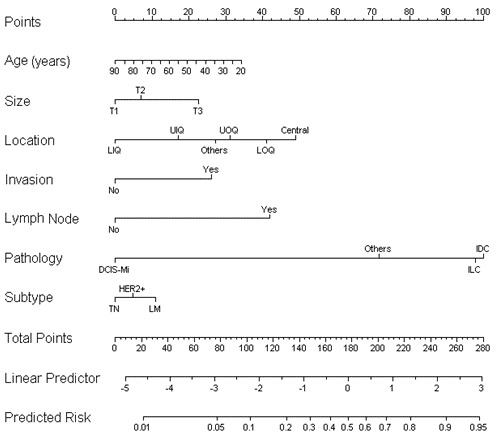
Figure 3. Nomogram for predicting the probability of axillary lymph node metastasis.

Age(years)- age at diagnosis in years; Size- clinical tumor size; Location- the location of tumor; Invasion- invasion of skin or chest wall; Lymph node- clinical lymph node status; Pathology- Pathological type; Subtype: molecular subtype There are a total of 11 rows in the nomogram. The behavioral variables are presented in rows 2 to 8, and points for each variable are correspond the scale in row 1. The points of the seven variables are added to the total points presented on the scale in row 9, which corresponds to the linear predictor and risk predictor of axillary lymph node metastasis in rows 10 and 11, respectively.
