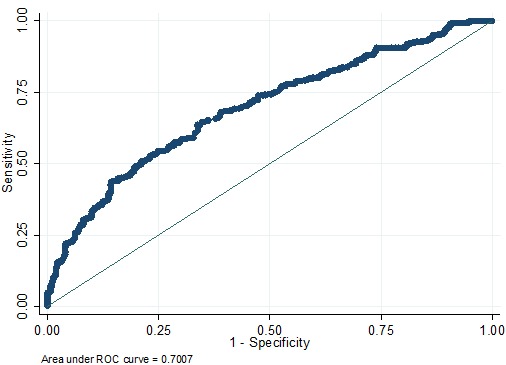
Figure 5. ROC curve of the predictive model for the validation cohort (n = 642) (ROC curve with an AUC value of 0.7007).

ROC, receiver-operating characteristic ROC; AUC, area under the ROC curve.

ROC, receiver-operating characteristic ROC; AUC, area under the ROC curve.