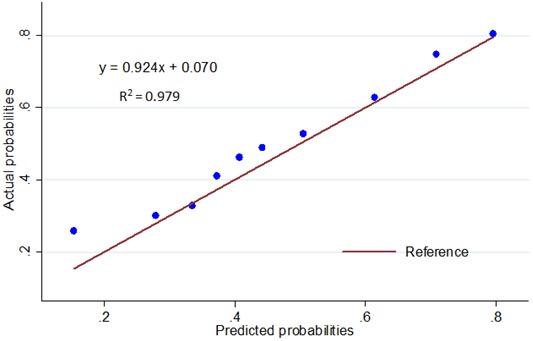
Figure 6. Calibration plot for the predictive model: The actual probability versus the predicted probability.

The reference line represents perfect equality of the predicted probability and the actual incidence of ALN metastasis.

The reference line represents perfect equality of the predicted probability and the actual incidence of ALN metastasis.