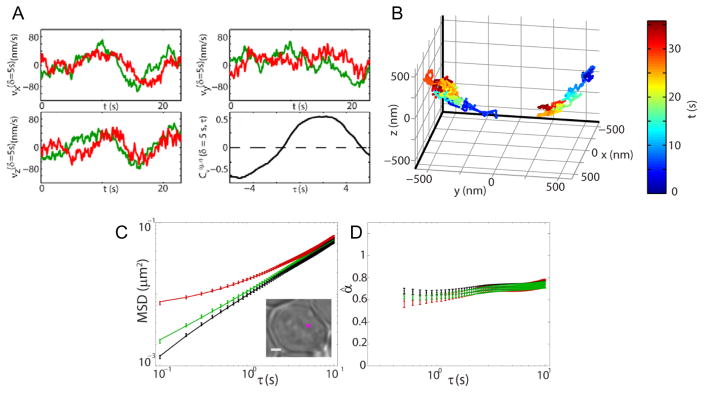
Figure 19.
(A) Example 3D velocities for a pair of GAL loci in budding yeast. The x, y, and z velocities as a function of time can be extracted from 2-color DH-PSF microscopy. Lower right panel: velocity cross-correlation between the two channels. (B) Spatial trajectories of the two loci with time-coloring. (C) MSD for a single locus imaged in green and red color channels with a mean cross-displacement in black. The inset shows an example trajectory with 1 μm scale bar. (D) Extracted estimates of the anomalous diffusion parameter using the proper expression for the MSD for fractional Brownian motion including static and dynamic errors. (A), (B) reproduced from ref. (268) copyright 2014 the authors, with material under Creative Commons license BY-NC-SA 3.0; (C), (D) reprinted with permission from ref. (270). Copyright 2015 by the American Physical Society.

