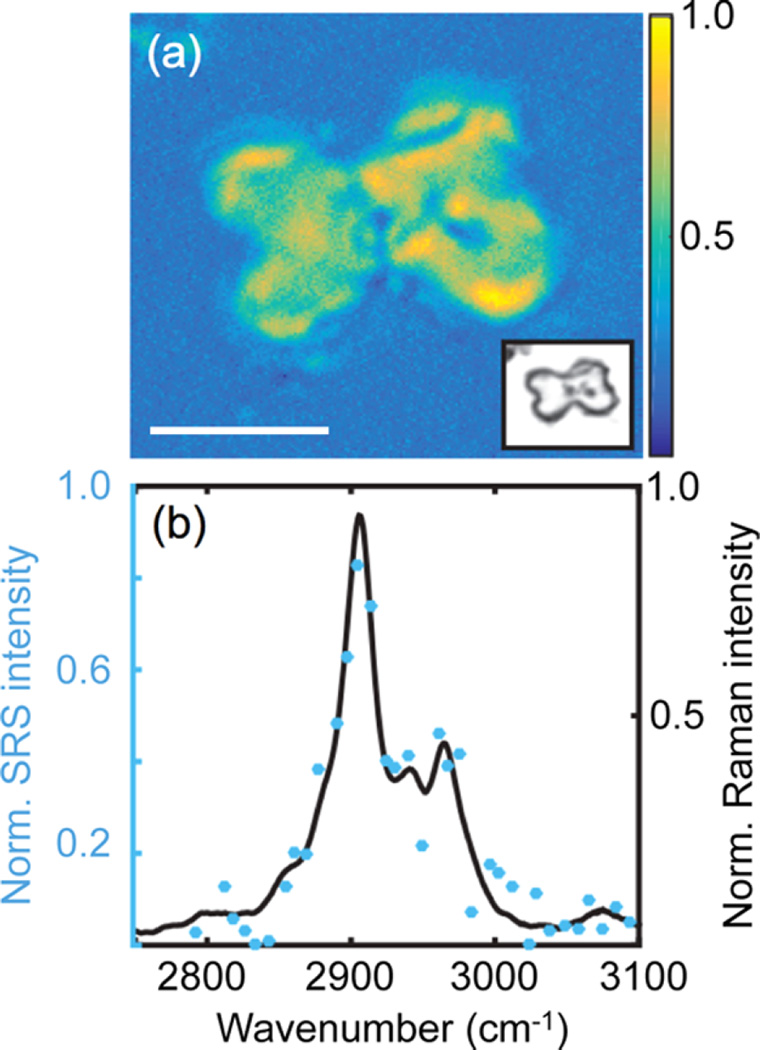
Figure 11.
Hyperspectral SRS imaging of carbohydrate content in phytoliths. (a) SRS spectral component image of a single phytolith. Brighter pixels exhibit a higher weight of the spectrum displayed in (b). The inset shows an electromicrograph of the same phytolith. Scale bar is 10 µm. (b) Carbohydrate SRS component spectrum after a vertex component analysis (blue ●), superimposed onto the spontaneous Raman spectrum (black line). Adapted with permission from ref 153. Copyright 2015 Gallagher, Alfonso-Garcia, Sanchez, Potma, and Santos.

